The “Average”: Corporate’s Favorite Rug for Sweeping Operational Sins Under
When the average looks safe, but customers are still waiting
Have you ever sat in a cross-functional meeting where someone proudly presents a dashboard and says, “We’re safe, boss, KPI achieved”? Sometimes that conclusion rests on just one number: the average.
Imagine the delivery lead-time target is 10 days. The monthly report shows an average lead time of 9 days. At first glance, performance looks good. But when we inspect each shipment, only 70% arrived in under 10 days.
How can the average still be 9 days? A small number of very fast deliveries—say, arriving in 1 or 2 days—can pull the average down and hide the experience of the other 30%. Some of those shipments may be severely delayed; the average alone cannot tell us how late they were or where the delays occurred.
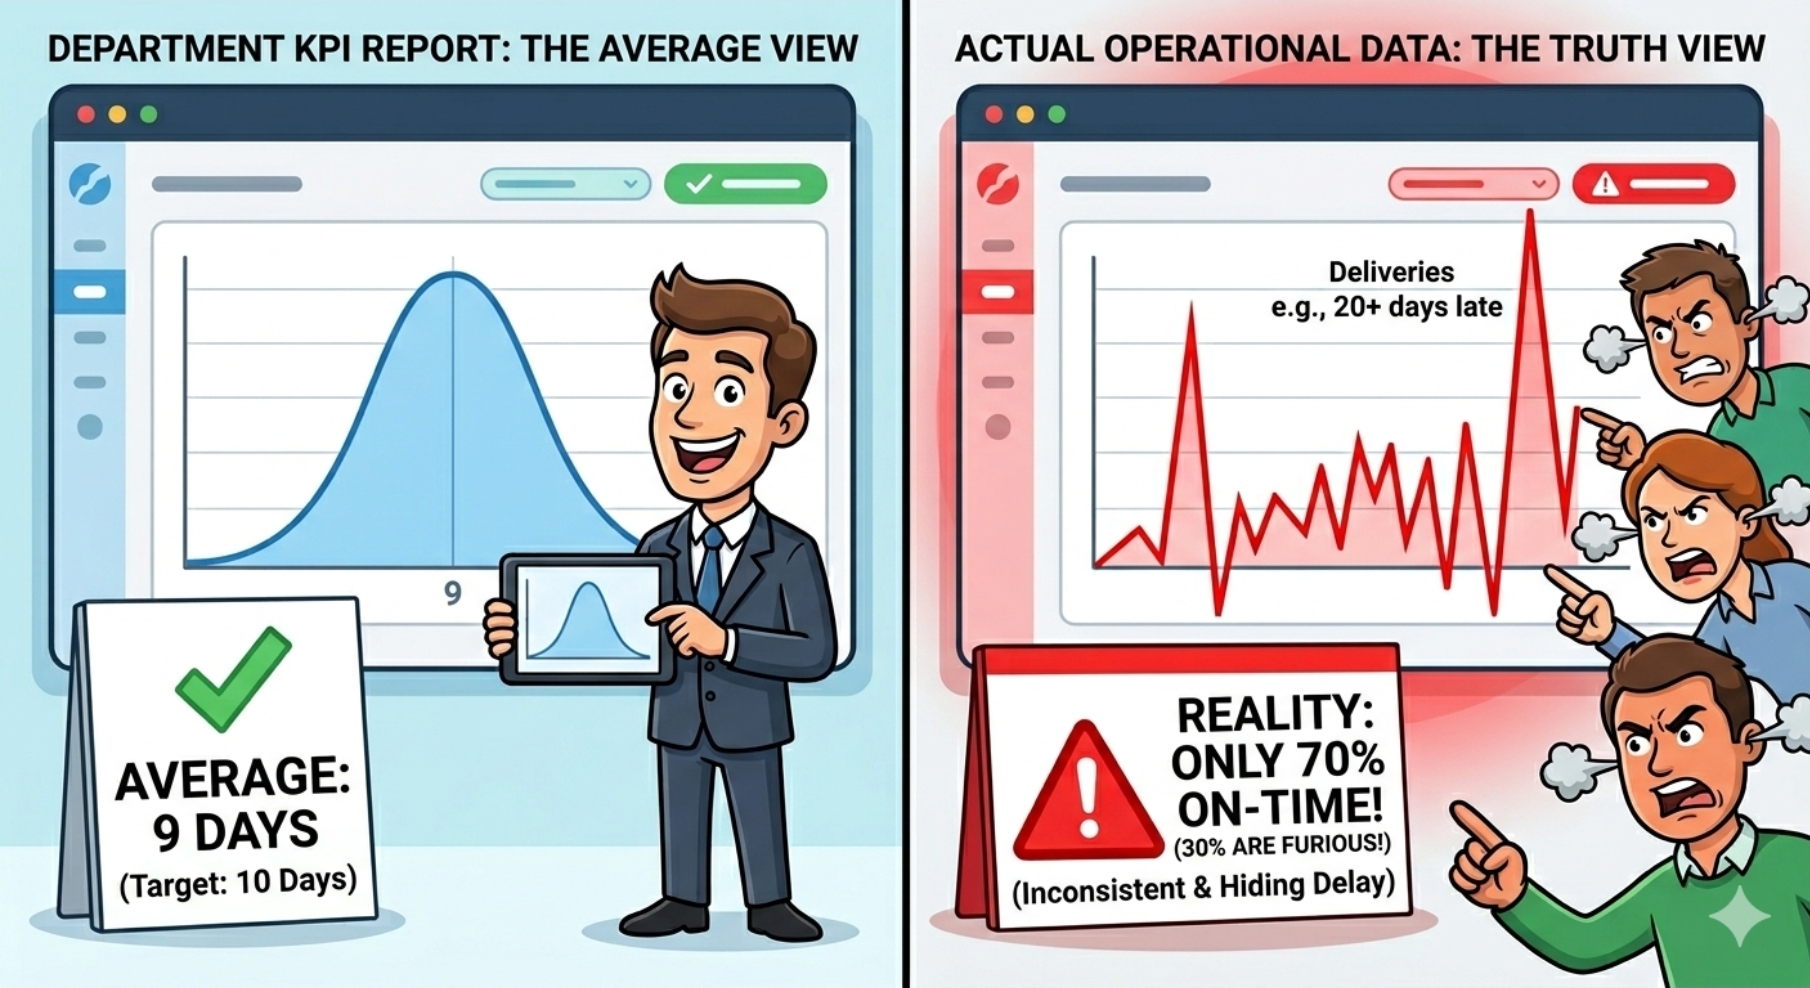
The average is not the whole story
An average is useful for summarizing data, but it does not show the distribution or variation behind the number. If we report only the average, we may miss the questions that matter most:
- What percentage of deliveries met the target?
- How late were shipments that missed it?
- Are delays concentrated by route, terminal, cargo type, or customer segment?
- Is performance improving consistently, or is it being lifted by a few exceptionally fast deliveries?
Customers do not experience the company’s average. They experience their own shipment’s delay—and its impact on service, inventory, and downstream operations.
Make dashboards more honest and useful
A good dashboard is not just about making charts look polished. It should help teams see operational reality and decide what to do next. For delivery-time metrics, pair the average with measures that show distribution and target performance, such as:
- On-time percentage, based on an agreed definition of the target.
- Median and percentiles, such as P90, to show a typical experience and more extreme delays.
- Lead-time distribution so variation and outliers are not hidden.
- Delay breakdowns by route, terminal, cargo type, or other relevant segments.
- Trends over time to distinguish sustained improvement from short-term fluctuation.
Before changing a process, align on the definition of “on time,” reporting period, data scope, and exclusions. That keeps comparisons fair and ensures every team interprets the KPI consistently.
From a green KPI to meaningful action
An average that looks safe does not necessarily mean customers are receiving good service. In supply chains, analysis that stops at the average can make systemic problems look like minor exceptions.
The goal of data visualization is not to make a report feel comfortable; it is to surface patterns that need attention. Show the summary, but always provide a way to explore the distribution and trace problems back to their operational context.
Question for discussion: Have you ever found a major problem hidden behind an average that looked perfect?